
 If you're running a business – especially a membership site or SaaS solution – then you're likely already looking at your numbers daily or weekly. You're paying attention to the numbers to look for trends and insights. Right?
As you may know, I spend some of my spare time coaching some WordPress startups. We get started and one of the things I'll ask for, if we're talking business models or growth, is the history of their growth. I'll get something that looks like this (see the image below).
We all start with Revenue data
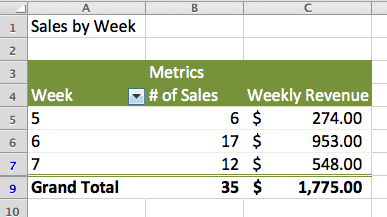 Now there's nothing wrong with this data, but what you'll see is that it's giving me three things – a) total revenue over a period of time, b) transaction counts per week over a period of time, and c) revenue per week over a period of time. In this example, instead of dates, you'll see week numbers (week 5 is the first week in Feb, for example).
Note: the data in today's post isn't an exact match for what I've seen. I'm not sharing company data.
So because this data answers those three questions, you could imagine that our dialogue moves around the questions that spring up from this data – like “What did you do in mid-Feb to drive more sales?” or “Simple math suggests you sold more valuable deals in week 6. Why?”
Then shift to Transactional data
These are fun consulting questions but rarely yield surprising answers that hold the key to future growth. That's because sometimes we (as people) try to add meaning after the fact, rather than doing difficult analysis.
So more often than not, the result is that they send me more transactional data like this.
But more data isn't necessarily better data.
To get better insights, we need to shift gears and do a little more work – something called cohort analysis.
What is a Cohort?
Remember when your mom was worried about you hanging out with the wrong kids at school? Yeah, that was a cohort. It was a group that had something in common (in this case, going to the same school). Any time you can group people by some aspect of who they are (or what they've done), you can create a cohort.
Now why would you want to do that?
The simple reason lies in the fact that you can discover new insights via a cohort analysis. You group the data using what's called a pivot table. But before we do that, let's look at how we create the report I'm talking about.
Digging into the Business Model
We dig into a model because we want to understand how things work. In this case, a customer signs up, picks a plan, but starts with a free trial. There is, however, incentive to log in and make the call to join this site's membership as soon as possible, because it automatically upgrades them to the features of the next larger plan. That's when they're charged.
So even though we had the “registration” date, we needed more. What you see here is that I asked for both the registration date, but also when people made the final call to join. And with those two dates, I can create two new columns (C and F).
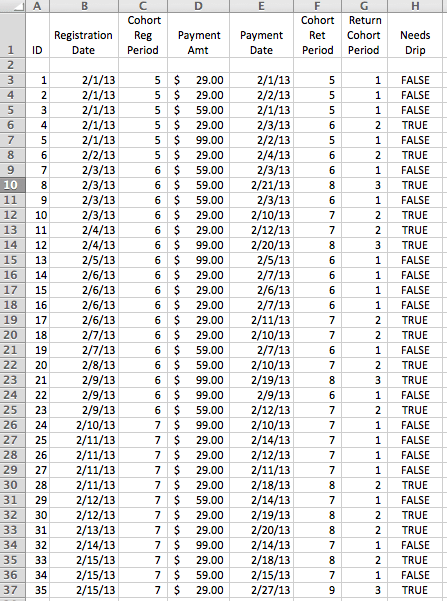 In this case, because so much was done around weeks, I use an Excel function to give me the week number. It's this simple for column C: =WEEKNUM(B3) and again, on row 3 for column F: =WEEKNUM(E3).
What am I doing?
I'm creating a new variable to group my cohorts. I want to know what week of the year people registered, and what week of the year they came back with a decision. I can measure that relative distance between the two points by subtracting C from F. That's what you see in Column G.
That's the heart of this particular cohort analysis. Because when I do that, I notice some things – there's a lot more 1's in that column than 2's or 3's. What does that tell us?
It says that people who come back and login and make the decision in the first week of their registration convert better than when they come back two or three weeks later.
You can create a Pivot Table to validate this sense.
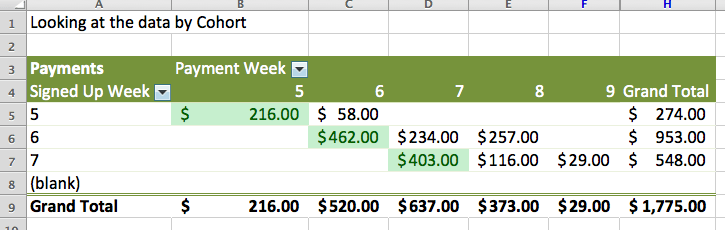 See the highlighted cells? It tells us that people who pulled the trigger the first week of their trial converted better than folks who came back later.
Now, if you knew that, couldn't and wouldn't you want to do things to bring them back the first week? Might you create a stronger and automated drip campaign to woo them back quickly?
Yes, I think you would.
But only if you'd done a cohort analysis.
Cohort Analysis Can Help a Lot
The truth is that cohort analysis isn't simply useful in this sign-up process.
- It helps you look at attrition.
- It helps you look at up-sells and cross-sells.
- It helps you investigate tickets (right after activation, vs much later).
It's not as hard as the foreign words feel in your mouth. And Excel does a lot of the work for you.
So what are you still doing here. I'm not going to do it for you. Get out of here and start analyzing your data.
If you want some help, you know how to reach me.